The Problem.
Our client wished to gain a better understanding of how concrete railroad ties were impacted by wear and weather. The resulting cracking structure is not visible by examining the exterior of the railroad ties and destructive tests would typically alter the cracking patterns. We were asked to use CT imaging to see inside the concrete ties.
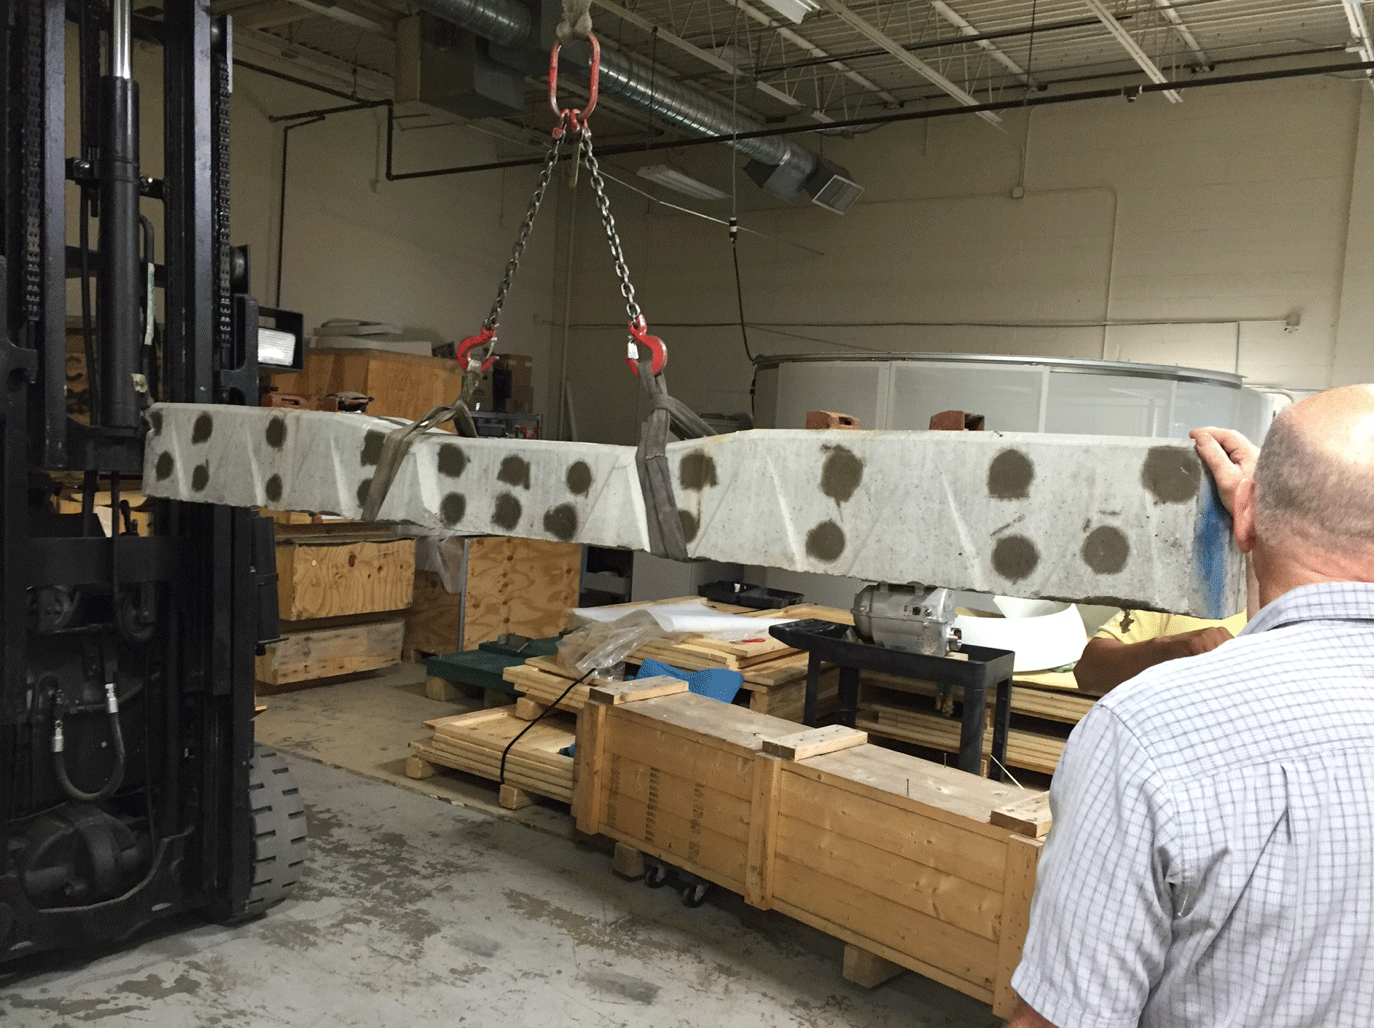
A sample concrete railroad tie is shown in Figure 1 below. The concrete railroad tie is typically 8 ½ feet long, with a cross-section of approximately 12” x 12”. The weight of each tie is approximately 700 lb. but the CT scanner patient table is designed to support less than 500 lb.
Figure 1: Sample concrete railroad tie.
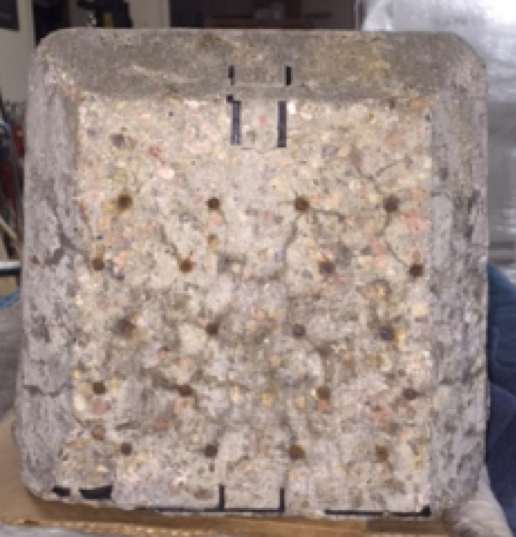
Because of its density and x-ray attenuation coefficient, concrete requires approximately 3 times more x-ray strength for penetration. Additionally, as shown in Figure 2 below, each concrete railroad tie is internally supported by about 20 steel rods (rebar) that extend the entire length of the tie.
Figure 2: Supporting steel rods (rebar)
Overview.
Plexar was able to provide a method to non-destructively look inside sample concrete railroad ties to visualize the cracking structure.
The Solution.
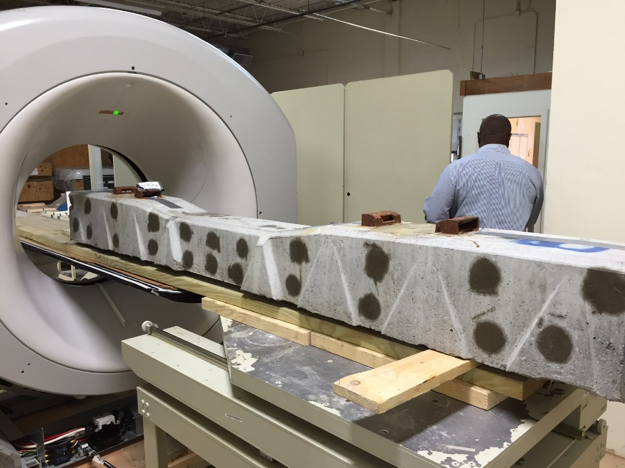
To solve the weight problem, a “follower table” was positioned behind the scanner as shown in Figure 3 below, dispersing the weight from the patient table.
Figure 3: “Follower table” takes weight off of the patient table.
The scanner had adequate x-ray strength to penetrate the concrete, so we were able to collect cross-sectional images but the image quality made the images unusable for the intended characterization. As shown in image A in Figure 4 below, there was very high image noise due to the high attenuation of the concrete and the rebar created significant streaking artifacts.
Figure 4: One cross-sectional image shown from initial raw state to final improved image
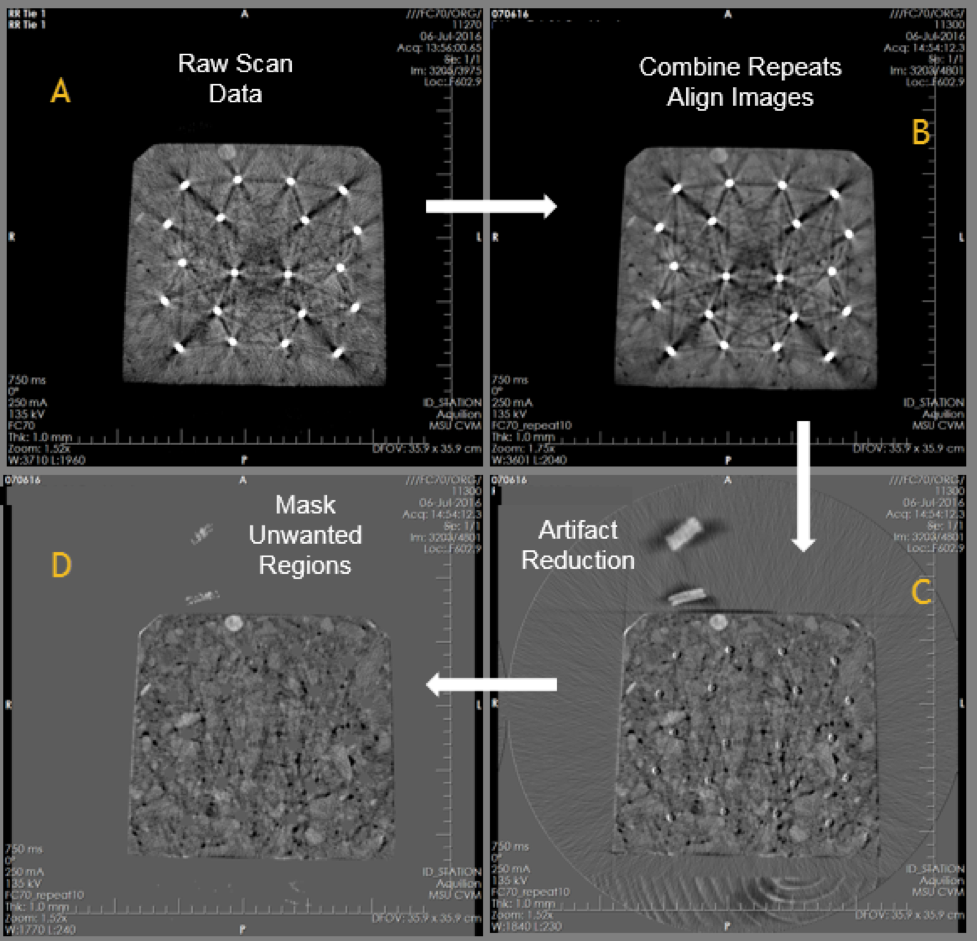
We developed three key procedures that were sequentially applied to the images, producing results that allowed the internal structure to be quite visible. These three steps are shown in Figure 4 above by following the arrows.
- A to B: We reduced the random image noise by taking 10 repeat scans and averaging the repeat scans.
- B to C: We developed an algorithm that used multiple passes and slice to slice characteristics to determine an accurate artifact pattern. Then, in the final pass, the artifact pattern was removed, leaving only a small residual portion of the rebar.
- C t0 D: We then applied a mask that removed unwanted portions of the image but keeping the background in those unwanted regions.
The best way to appreciate the overall improvement is by comparing the original image A with the final image D in Figure 4.
These three procedures were applied to all slices of the CT scan so that images were produced over the whole length of the railroad tie. In addition to reviewing the individual improved images, our client was able to inspect the images using 3D viewing software and thereby follow the cracking structure in the sample.