
The Problem.
There have been over 200 documented cases of jet engine power loss events during flight at high altitudes. It is recognized in the industry that supercooled liquid water does not exist in large quantities at these high altitudes and therefore it is expected that the events are due to the ingestion of ice particles. Icing research test facilities have been developed to emulate these high-altitude conditions while performing jet engine tests.
Calibration of the icing research facility is a critical component of accurate testing. That calibration, however, has been a laborious and expensive process. Manual measurements are time consuming and assume that cloud uniformity and density does not vary greatly between the periodic calibrations. Also, manual measurements can only be done when the facility is off-line.
Overview.
In partnership with NASA, Plexar has developed a promising new optical tomography technology that is being used to acquire real-time in-situ icing cloud uniformity and density measurements in the NASA icing research facilities.
The Solution.
Our optical calibration technology provides the means to make these measurements in-situ in real-time and minimize the need for these manual measurements. This technology uses the principle of light extinction to collect measurements about the spray density in a test facility. The measurements are then combined using tomographic reconstruction to produce temporal images that represent the ice cloud density and its variation over time.
The optical calibration technology overcomes the limitations of manual measurements. Problems with the icing cloud geometry can be detected and corrected. Changes to the icing spray over time can be monitored and recorded.
Description.
The technology was developed at the NASA Glenn Research Center for both of the NASA icing research facilities: the Propulsion Systems Lab (PSL) and the Icing Research Tunnel (IRT). These installations are described in detail in two presentations made at the American Institute of Aeronautics and Astronautics annual conferences:
PSL Facility.
For the PSL installation, the wind tunnel is modified to include a Tomography Duct as shown in Figure 1 below.
Figure 1: Tomography Duct
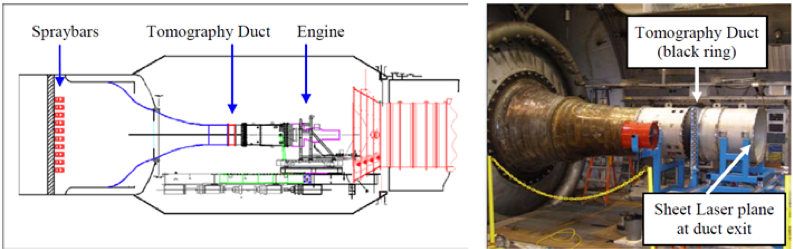
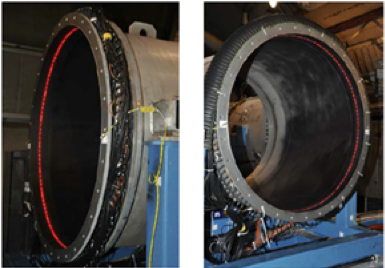
The Tomography Duct consists of 60 equally spaced laser diodes with sheet generating optics and diffusing elements providing >300° coverage around the ring and 120 fiber optically coupled detection elements mounted every 3° around a 36” diameter ring. A cutaway view of the Tomography Duct is shown in Figure 2 below with all lasers turned on.
Figure 2: Cutaway view of Tomography Duct
It takes two measurement conditions to generate an image of the density and uniformity of the cloud: a reference condition when no cloud is present, and a second when the cloud is present. The data sets are reconstructed using tomographic algorithms related to, but distinct from those used in medical imaging. The reconstruction employs smooth basis functions as opposed to the sharper functions used in medical applications.
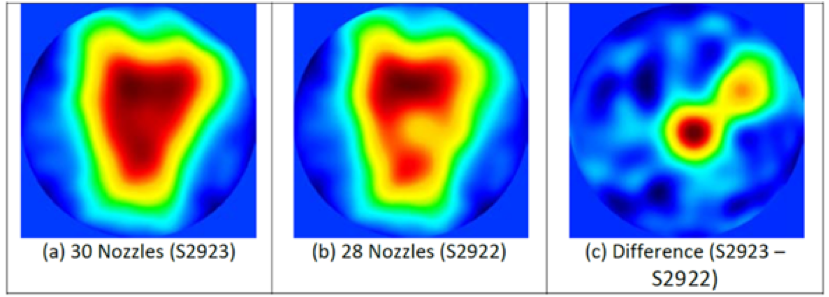
An example of the reconstruction is shown in Figure 3 below in which images from two distinct spray configurations were acquired; one with 30 nozzles active and one with only 28 of the 30 nozzles active. As shown in the figure, the reconstructed images of the two spray configurations are very similar. However, a subtraction of the reconstructed images clearly shows the location of the two inactive nozzles, suggesting that the system has the capability to dynamically track the status of specific spray nozzles that may change during a spray.
Figure 3: Reconstructed PSL images of (a) 30 nozzle ice cloud, (b) cloud with only 28 of the 30 nozzles active and (c) the difference between the two images.
IRT Facility.
For the IRT facility, the tunnel was modified with a removable rectangular tomography gantry as shown in Figure 4 below.
Figure 4: IRT tomography facility in rectangular tunnel, looking downstream
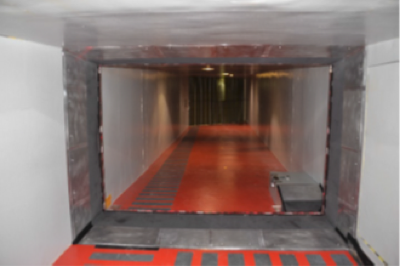
The prototype development tomography apparatus was mounted slightly downstream of the test section. It consisted of sixty (60) laser diodes with sheet generating optics spaced every six degrees around the periphery of a 6 ft by 9 ft frame structure. In addition, one hundred twenty (120) fiber optically coupled detection elements were mounted every three degrees around this same structure.
As in the PSL, two measurements are acquired: a reference condition when no cloud is present, and a second when the cloud is present. Classical tomography algorithms rely on regular line sampling. The rectangular geometry of the IRT yields an irregular sampling. Due to the relatively low sampling density, there is not sufficient data to interpolate back to a regular sampling pattern, so traditional tomographic reconstruction algorithms cannot be applied. The approach for the IRT system was to apply a variant of a linear fit algorithm using Gaussian blob image basis elements.
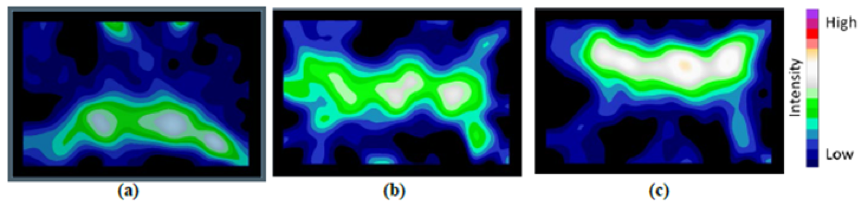
The primary goal of the prototype installation was to gain specific understanding regarding the performance and requirements for a tomography installation in this setting. One test is illustrated by the image in Figure 5 below in which three (3) test conditions were analyzed. In these three cases only a particular horizontal row of spray bars (lower, middle, and upper) were activated.
Figure 5: (a) lower spray bar only, (b) middle spray bar only and (c) upper spray bar only.
